Data analysis and Geostatistics
2024
Exercises
Lab 1: Data distribution and descriptors Exercise_1.xls
Lab 2: QA/QC and levelling Exercise_2.xls
Lab 3: Statistical testing and the US elections Exercise_3.xls
Lab 4: Analysing time series data Exercise_4.xls
Lab 5: Multivariate methods (DFA, CA, PLS-DA) Exercise_5.xls
Lab 6: Open forum, bring your own data and statistical challenges
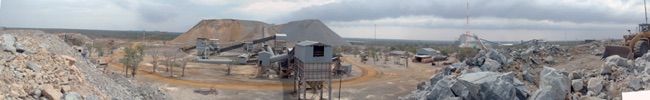
Overview of the dumps of a Ni-PGE mine in Botswana.
Copyright: Vincent van Hinsberg & Simon Vriend

Last updated: March 2024
Labs - applying statistical tools to geological data
The best approach to learning (geo)statistical tools, interpreting their results, and identifying how and where these tools can aid in understanding data, is in working with real-world geo-data. We will do in this in two ways in the lab component of this course. In order to apply the tools and methods discussed in the lectures, and become familiar with calculating statistical properties in spreadsheet programs and the PAST statistics software, there will be a set of exercises in the afternoons of the short course. The last afternoon on Thursday, March 28, will be an open forum where you can bring your own data and work together on how best to mine these data statistically, or work through specific challenges or issues.
If you are taking the course for credit, you will also work towards progressively understanding a large dataset of litho-geochemical samples from BC using the various statistical tools and approaches that have been discussed in the lectures. The dataset contains geological information, element concentrations and field observations, which will have to be explored in combination.
The BC dataset is original unmodified data as provided by a variety of laboratories and should therefore be thoroughly checked before starting with your analysis and interpretation. All sub-datasets contain a wealth of statistically interesting features and it is impossible to discover all. That is not the point of the project and I will not grade your report based on whether or not you found everything and tried every technique. The purpose is to dissect and understand the dataset so that you are able to interpret the data in a geological and geochemical context, and your reports will be graded on the level of insight into these data. There are many ways to dissect a dataset and there are generally a variety of statistical techniques that will lead you to the same conclusion. So feel free to attack this dataset in whatever way you like, but the following statistical tools should at least be included;
• data description (e.g. mean, IQR, median, mode etc)
• scatter diagrams, box-and-whiskers plots, histograms
• tests of distribution, cumulative frequency diagrams
• correlation tests and correlation matrices
• t-tests, F-tests or their rank-equivalents
• analysis of variance
• cluster and/or discriminant function analysis
• principle component and/or factor analysis
• (multiple) regression analysis
• spatial analysis of the data, maps, semivariograms
You are strongly encouraged to work on the exercises and project together and are free to work on these during the labs or at any time convenient to you. I will be available during lab times to discuss the exercises and to answer any questions regarding the project.
A report on the data analysis project is to be handed in at the end of the course and counts 50% towards the final grade. This final report should be approximately 10 pages in length, excluding tables and figures (these are recommended to be put into appendices). One report is to be submitted per group.