The plots below were generated with Thomas Lecocq's ObsPy code in a Jupyter notebook. The green background is weekday, the white is weekend. The blue trace represents the seismic noise between the frequencies of 4 Hz and 14 Hz. It's lower at night and higher in the day. The purple line is the average noise from 6:00 to 16:00 local time each day. Social distancing measures are indicated on the dates they took effect.
The Raspberry Shake (RaspberryShake.org) is an inexpensive geophone and digitizer attached to a Raspberry Pi single board computer.
Links:
ObsPy reference wiki
Nature article by Elizabeth Gibney reporting initial lockdown results
NDG neighborhood, Raspberry Shake R9499
March-April 2020, Social Distancing
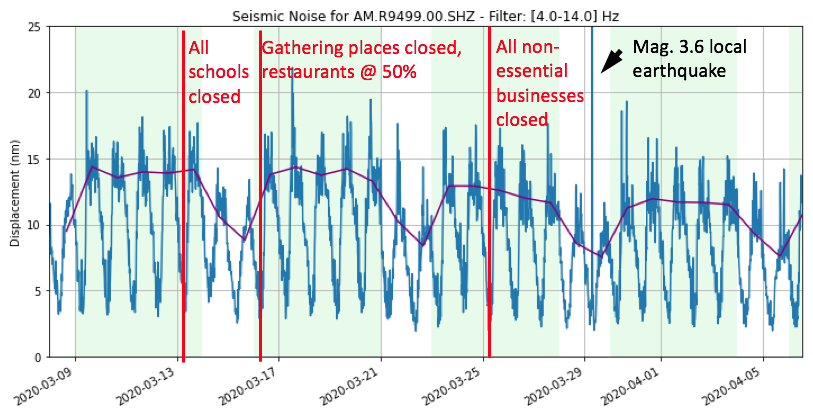
A diminishment in daytime activity is apparent. To evaluate the effectiveness of the government mandate, a similar plot was made spanning the end of December holidays:
NDG neighborhood, Raspberry Shake R9499
December 2019-January 2020 Holidays
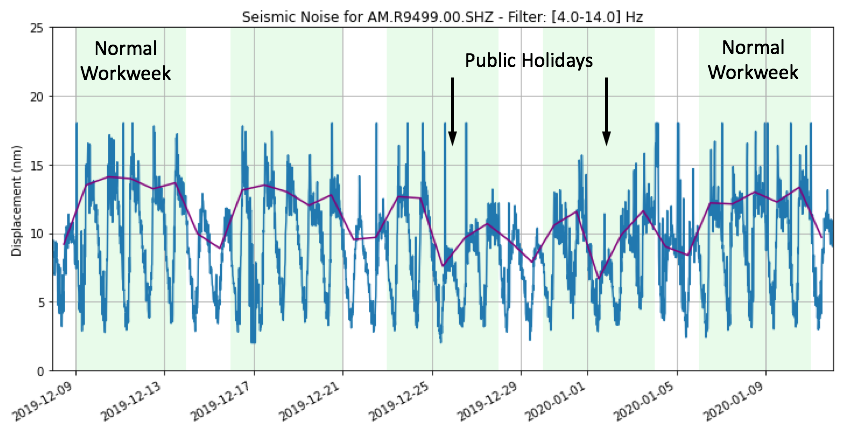
Current seismic noise (first plot) is still greater than that on the civic holidays of December 25th and January 1st.
The amplitude of the seismic noise is determined by a number of factors in addition to local activity: the location of the seismograph (a residential basement) and the characteristics of the subsurface. The NDG neighborhood is located on top of clay deposited at the end of the last Ice Age, with very low shear wave velocities, which tends to amplify the urban seismic noise:
Montreal near-surface shear wave velocities
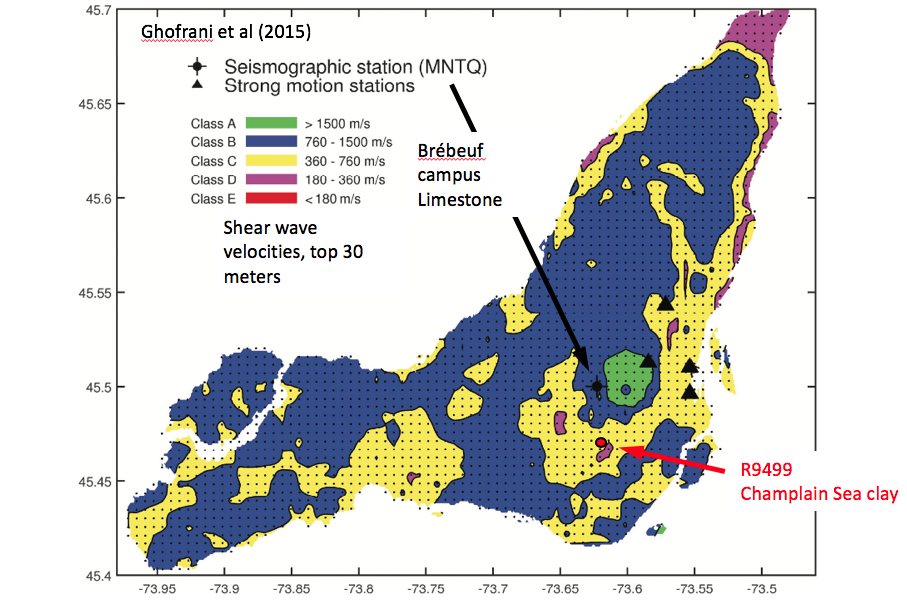
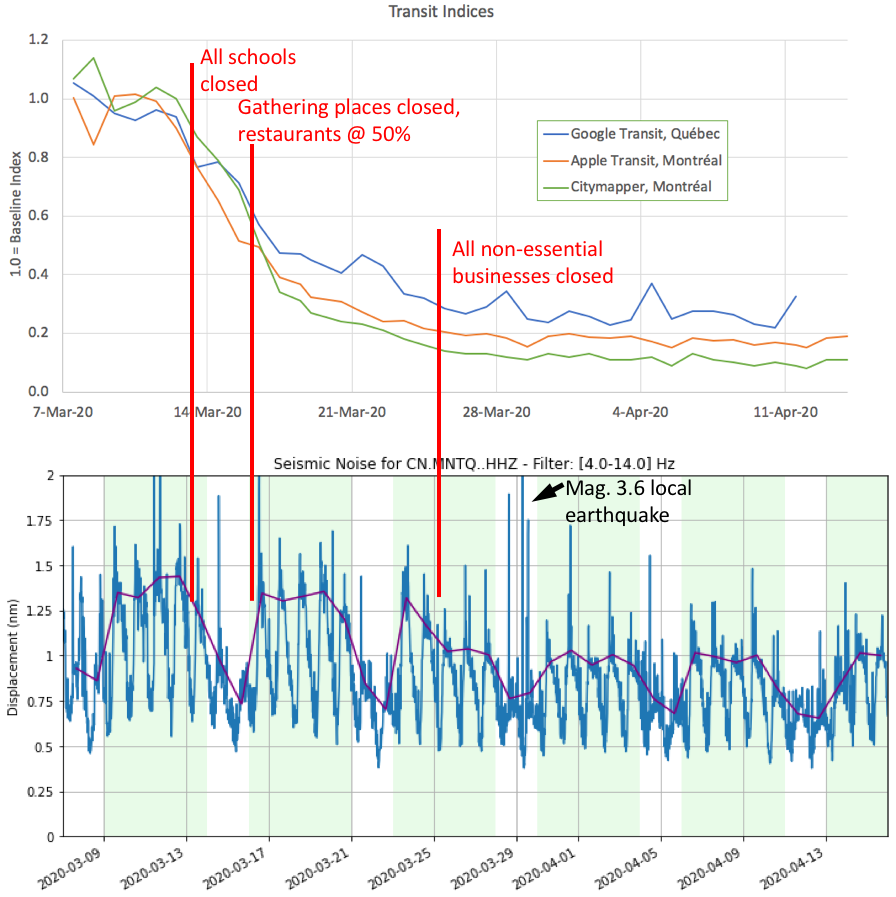
The Canadian National Seismograph Network maintains a broadband seismometer nearby (MNTQ). This instrument is located on a solid pier above limestone bedrock with higher shear wave velocities. Seismic noise from March-April 2020:
Brébeuf campus, CNSN MNTQ
March-April 2020, Social Distancing
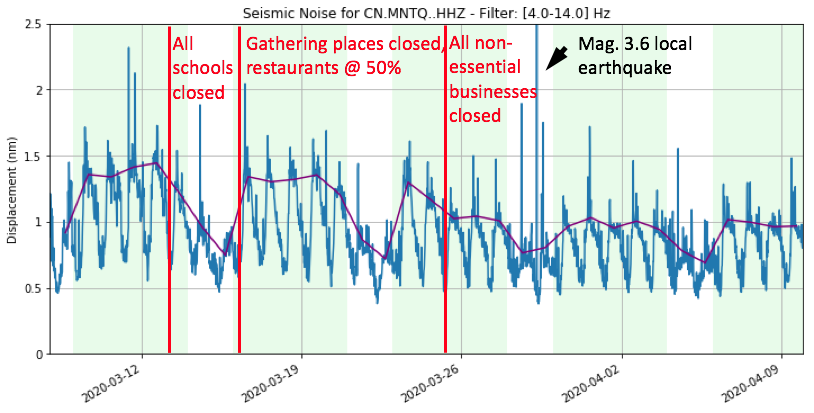
This seismograph records seismic noise at an order of magnitude lower amplitudes! This is due to the type of instrument, the location, and nature of the subsurface.
Other indicators of the social distancing measures
Cell phone Mobility Indices
Below is a comparison of mobile phone-based measures of activity (the transit Mobility indices of Google, Apple, and Citymapper) with the average seismic noise (daytime, 4-14 Hz). The Mobility indices drop as soon as public schools are closed and then public gathering spots (pools, gyms, etc) are closed, but there's no real reduction in seismic noise until there's a general closure of most all businesses. I've used the CNSN MNTQ broadband station, but the R9499 Raspberry Shake shows this pattern as well, but with less precision. Note that April 10 (Friday) and April 13 (Monday) are civic holidays this year in Québec.
Sources:
Apple Mobility trends
Citymapper
Google Community Mobility Report